NEIGHBORHOODS
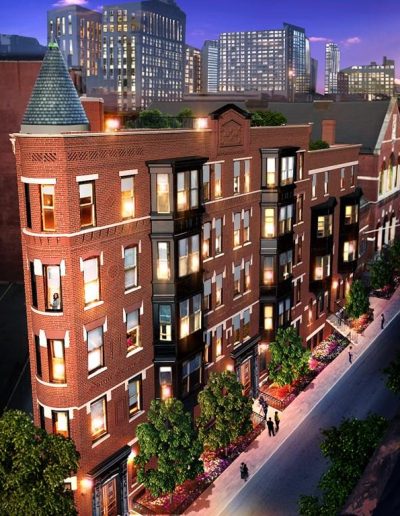
Bay Village
Overview
Located just a couple blocks south of the Boston Public Garden, Bay Village lies between Back Bay, South End, and the Theatre District. Inside these six square blocks is Boston’s smallest neighborhood officially recognized by the city. Its borders are represented by much busier streets but once you leave Arlington or Charles Street, you enter into a world where the buzz of city fades away. A strategic system of one way streets keeps cut through traffic at a minimum.
With easy access to South End, Back Bay and Midtown alike, many suggest that this location is hard to beat and real estate pricing has historically come at a relative value. For data tracking purposes, we file it within the South End.

Make Bay Village Home | Boston Neighborhoods
Explore Bay Village and all of its irresistible residences with Columbus & Over Group’s Sabrina Silva.


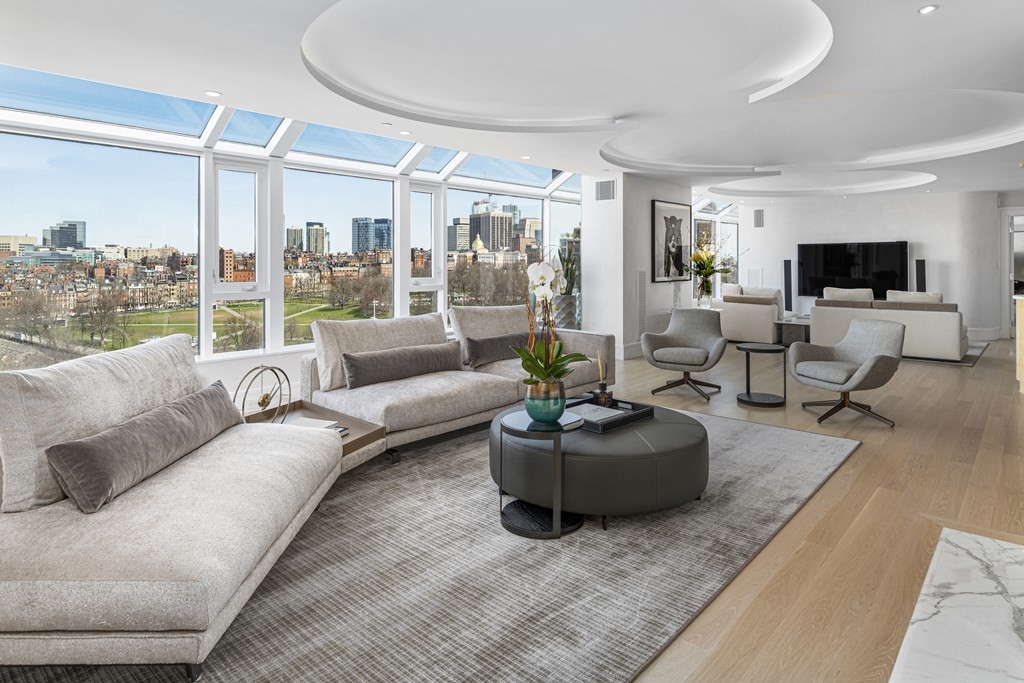
Explore Our Exclusive Listings
Find the home you’ve been searching for by exploring our exclusive offerings.
$2M+ LUXURY MARKET DATA
In 2025, we saw 7 home sales over 2mil totaling $17.53M in Bay Village. Despite its small sample size, the neighborhood showed renewed momentum compared to the prior year, with transaction volume above 2mil rebounding meaningfully from only two sales in 2024. Average pricing landed at $1,084 per square foot, down from 2024’s $1,156 per square foot, suggesting slightly softer pricing even as overall activity increased.
$17,525,250
TOTAL SALES VOLUME
$1,084
AVG. PRICE PER SQ. FOOT
7
NUMBER OF $2M+ PROPERTIES SOLD
Ever wonder where you might fit best in Boston’s 23 sub-neighborhoods?
Ever wonder where you might fit best in Boston's 23 sub-neighborhoods?
Read More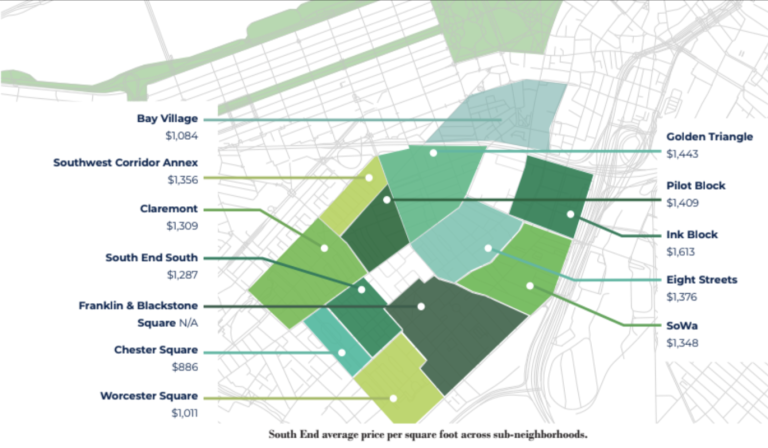
Back Bay & South End: A Look at Boston’s Luxury Sales in 2025
2025 Was a Year of Recalibration at The Upper End of the Boston Market Activity persisted, but it…
Read More
2021: Introducing our Annual Report
Thank you for your interest in our third annual “Boston Luxury Real Estate Review.” As we wrote our…
Read More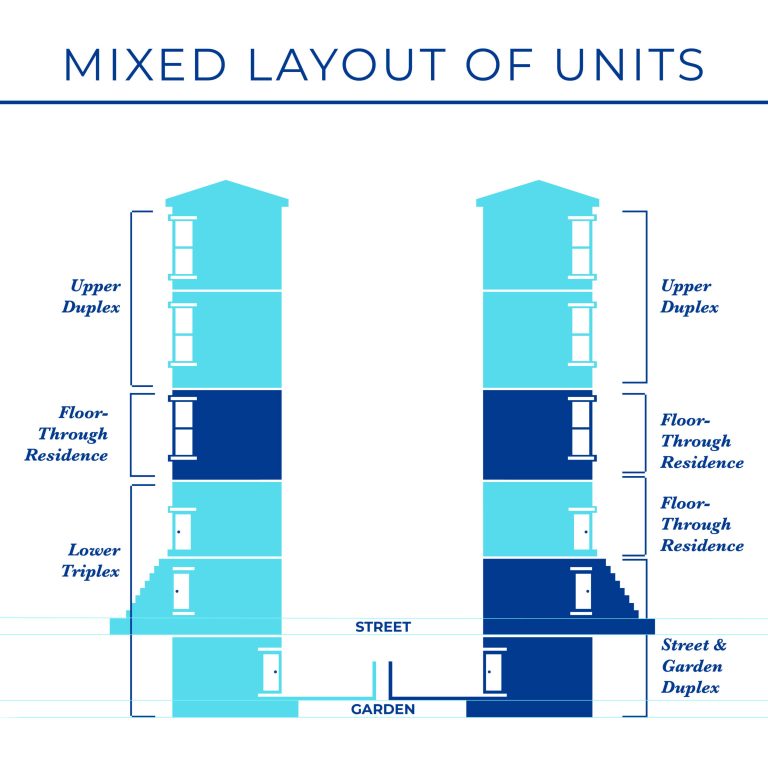
Top Five South End Building Configurations
What are the different configurations of a south end brownstone? Single family: We see a wide variety of…
Read More
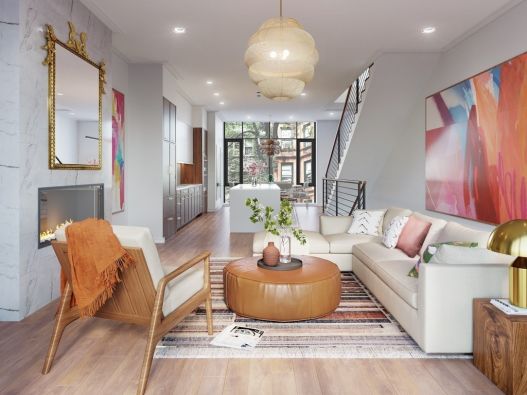
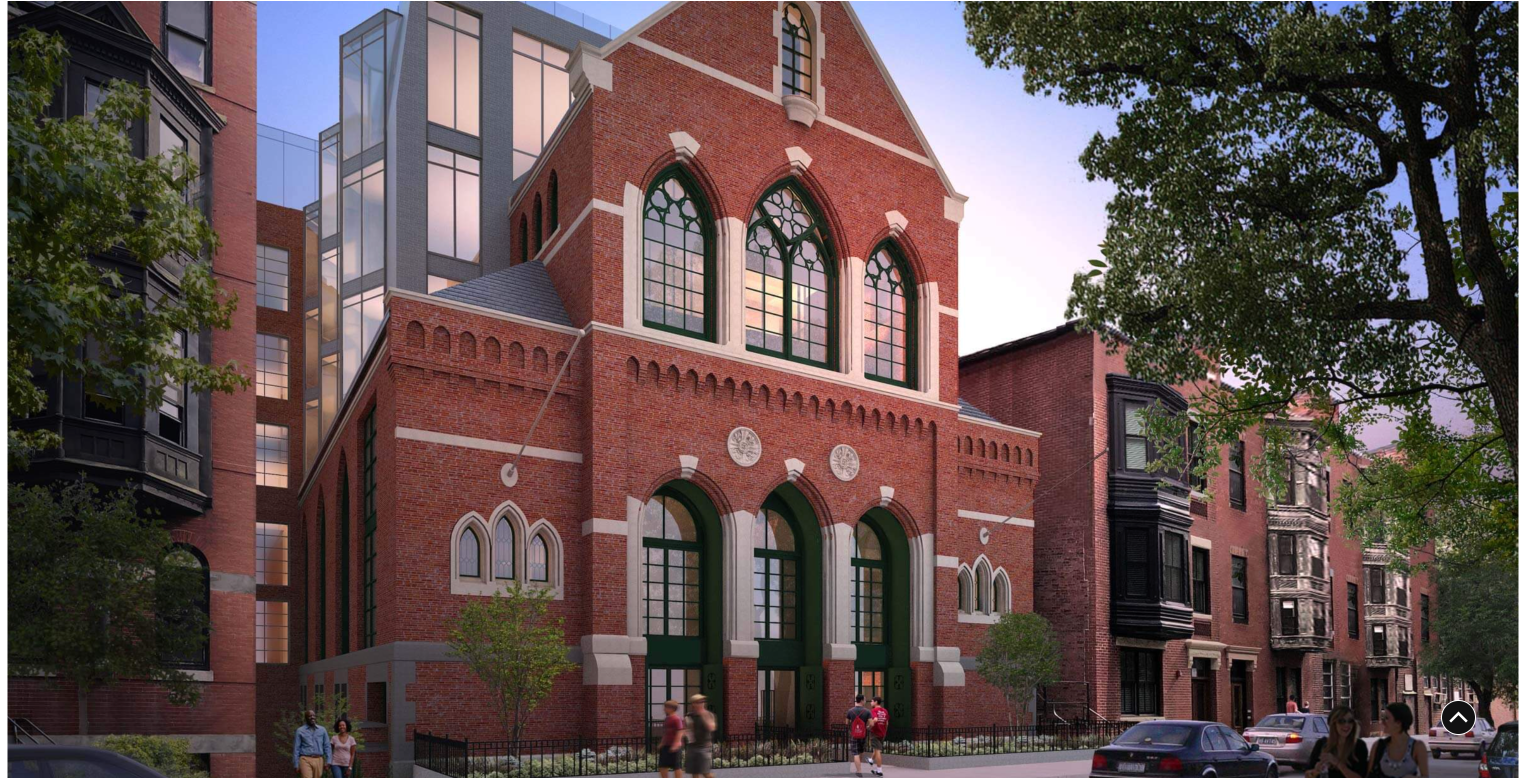
New Construction at 11 Isabella Street in Bay Village Complete!
The four condominium units at The Ellory were the result of a complete renovation of a brownstone building…
Read More
Rumors say the market is slowing, but do the numbers agree? A South End Update
With the possible exception of May, April is unlike any other month in our real estate calendar… we…
Read More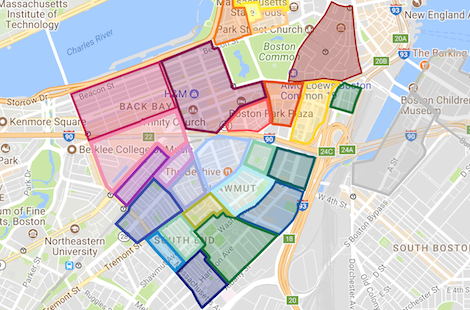
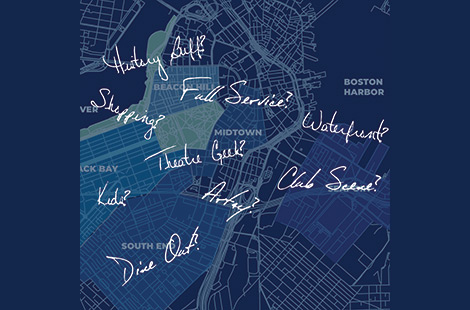
Interactive Boston Neighborhood Map
This map pinpoints the areas that Columbus & Over Group services, including South End, Back Bay, Beacon Hill…
Read More
2018 South End Market Update
The South End luxury real estate market once again had a terrific year in 2017. Of our four…
Read MoreMeet Agents Who Specialize Here
Trusted Greater Boston Real Estate Advisors