Interactive Boston Neighborhood Map
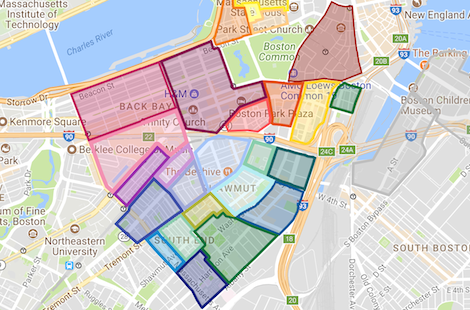
This map pinpoints the areas that Columbus & Over Group services, including South End, Back Bay, Beacon Hill and Downtown Crossing. We have broken each neighborhood up into designated sub-neighborhoods and hope this map provides insight into each of them.
Get Started1. Downtown Crossing
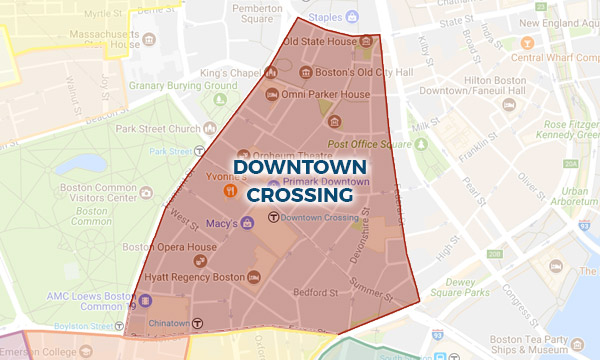
Address: Downtown Crossing, Boston, MA, USA
- Average # of Sales per 12 Month Period: TBD
- Average Days to Offer: 102
- Average Sale $/SqFt: $1,470
- 368 of the 458 sales in the past 12 months were at Millennium Tower
- Learn more about Downtown Crossing
2. Theater District
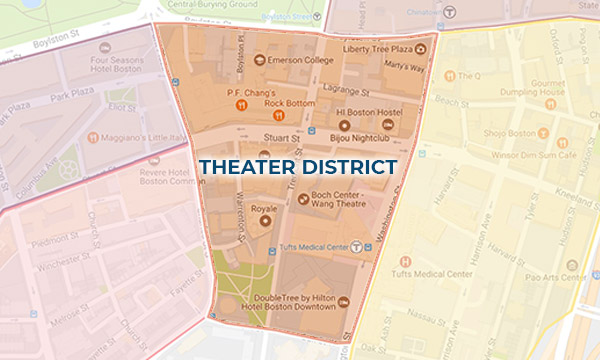
Address: Theatre District, Boston, MA, USA
- Average # of Sales per 12 Month Period: 10
- Average Days to Offer: 86.86
- Average Sale $/SqFt: $1,253
- Learn more about the Theater District
4. Leather District
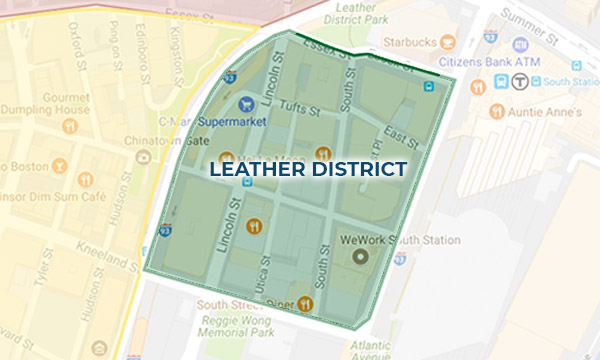
Address: Leather District, Boston, MA, USA
- Average # of Sales per 12 Month Period: 6
- Average Days to Offer: 45.6
- Average Sale $/SqFt: $627
- Learn more about the Leather District
5. SoWa
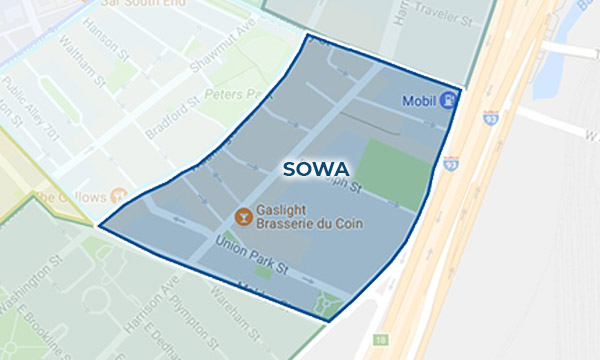
Address: SoWa, Boston, MA, USA
- Average # of Sales per 12 Month Period: 10
- Average Days to Offer: 47.30
- Average Sale $/SqFt: $1,085
- Learn more about SoWa
6. Worcester Square Area
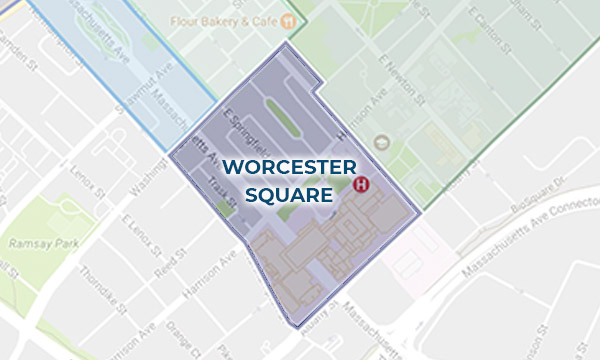
Address: Worcester Square, Boston, MA, USA
- Average # of Sales per 12 Month Period: 15
- Average Days to Offer: 41.45
- Average Sale $/SqFt: $879
- Learn more about Worcester Square
7. Chester Square

Address: Chester Square, Boston, MA, USA
- Average # of Sales per 12 Month Period: 4
- Average Days to Offer: 25
- Average Sale $/SqFt: $892
- Learn more about Chester Square
8. Claremont Neighborhood Association
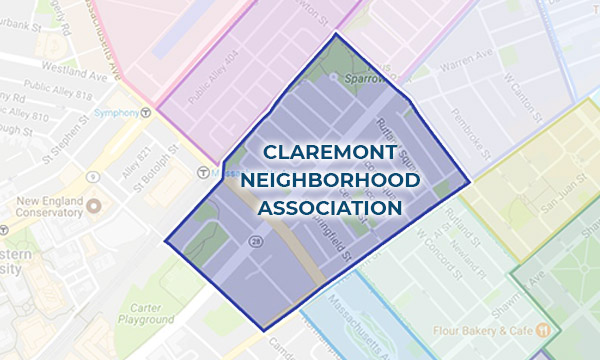
Address: Claremont Neighborhood Association, Wellington Street, Boston, MA, USA
- Average # of Sales per 12 Month Period: 31
- Average Days to Offer: 18.07
- Average Sale $/SqFt: $1,058
- Learn more about Claremont
9. St. Botolph
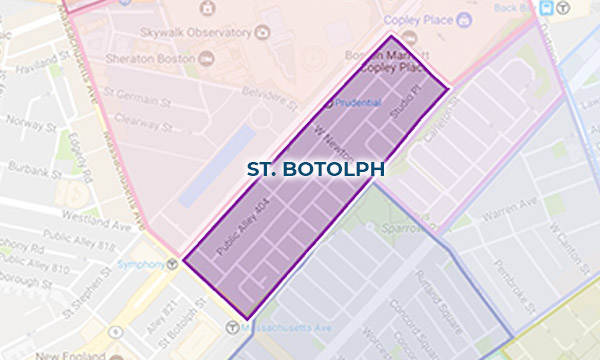
Address: St Botolph St, Boston, MA, USA
- Average # of Sales per 12 Month Period: 10
- Average Days to Offer: 20.9
- Average Sale $/SqFt: $968
- Learn more about St. Botolph
10. Southwest Corridor Annex

Address: SW Corridor Path, SW Corridor Path, Boston, MA 02116, USA
- Average # of Sales per 12 Month Period: 8
- Average Days to Offer: 16.91
- Average Sale $/SqFt: $1,139
- Learn more about Southwest Corridor Annex
11. Pilot Block
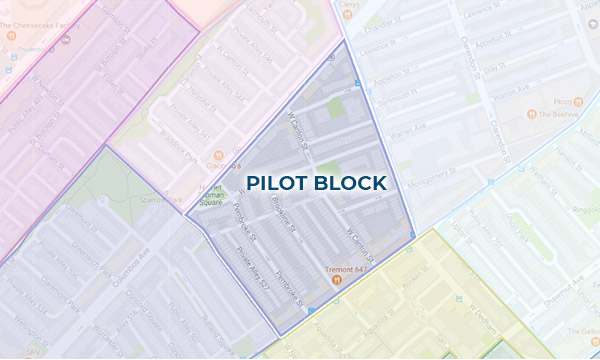
Address: 172 W Brookline St, Boston, MA 02118, USA
- Average # of Sales per 12 Month Period: 14
- Average Days to Offer: 17.25
- Average Sale $/SqFt: $1,089
- Learn more about Pilot Block
12. Golden Triangle
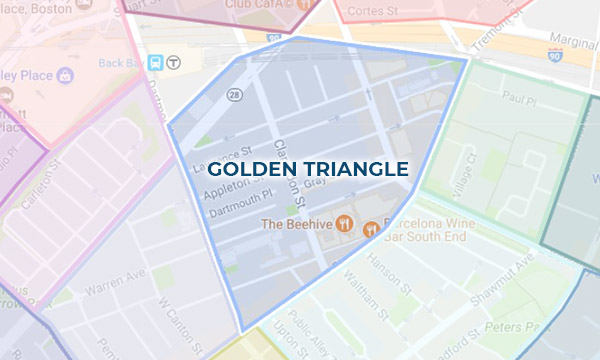
Address: 33 Clarendon St, Boston, MA 02116, USA
- Average # of Sales per 12 Month Period: 28
- Average Days to Offer: 28.86
- Average Sale $/SqFt: $1,131
- Learn more about the Golden Triangle
13. Eight Streets

Address: 16 Milford St, Boston, MA 02118, USA
- Average # of Sales per 12 Month Period: 35
- Average Days to Offer: 15.65
- Average Sale $/SqFt: $1,102
- Learn more about Eight Streets
14. Prudential
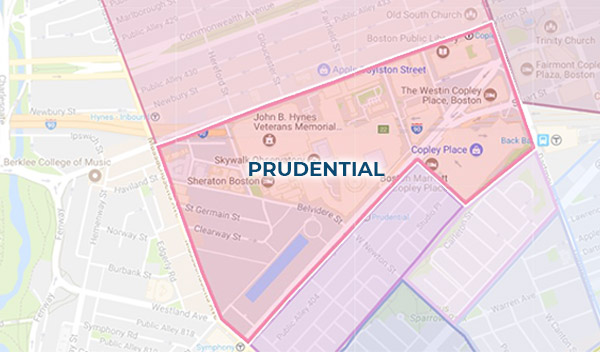
Address: Prudential, Boston, MA, USA
- Average # of Sales per 12 Month Period: 14
- Average Days to Offer: 106.78
- Average Sale $/SqFt: $1,609
- Learn more about Prudential
15. Upper Back Bay
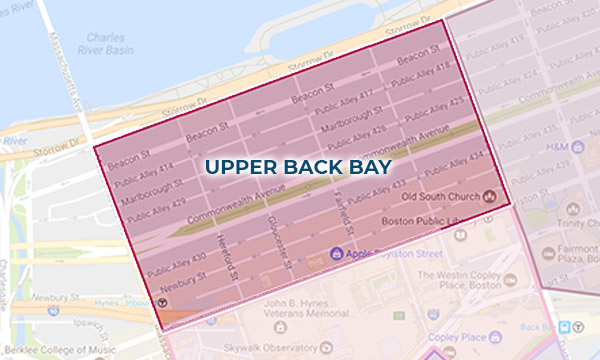
Address: Commonwealth Avenue & Fairfield St, Boston, MA 02116, USA
- Average # of Sales per 12 Month Period: 79
- Average Days to Offer: 42.58
- Average Sale $/SqFt: $1,238
- Learn more about Upper Back Bay
16. Lower Back Bay
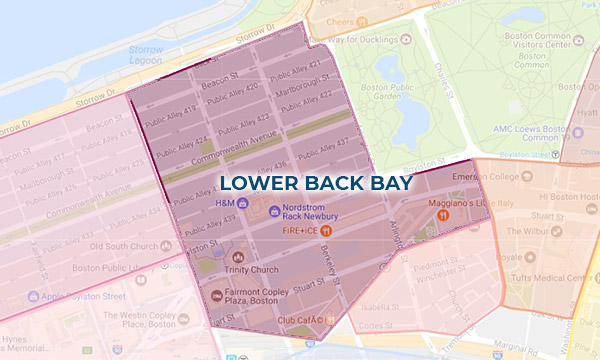
Address: 67 Newbury St, Boston, MA 02116, USA
- Average # of Sales per 12 Month Period: 82
- Average Days to Offer: 47.68
- Average Sale $/SqFt: $1,406
- Learn more about Lower Back Bay
17. Flat of the Hill
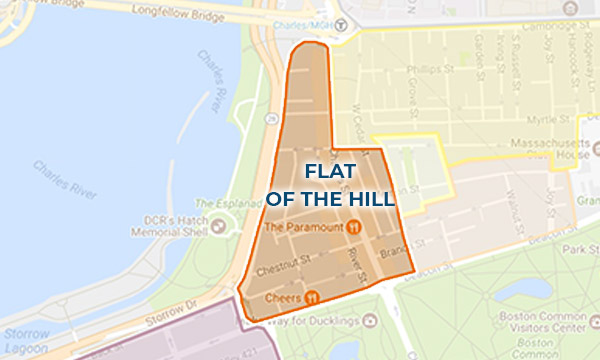
Address: Flat of the Hill, Charles Street, Boston, MA, USA
- Average # of Sales per 12 Month Period: 12
- Average Days to Offer: 58
- Average Sale $/SqFt: $1,152
- Learn more about Flat of the Hill
18. Front Slope
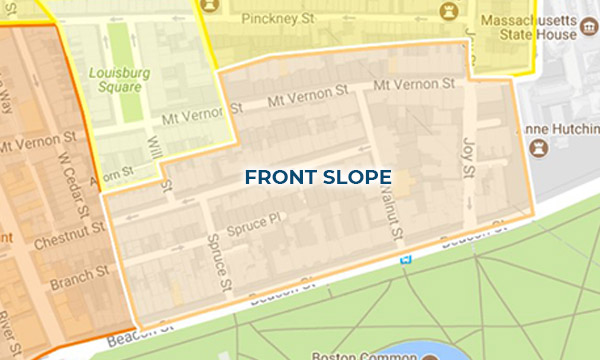
Address: 40 Beacon St, Boston, MA 02108, USA
- Average # of Sales per 12 Month Period: 9
- Average Days to Offer: 58.57
- Average Sale $/SqFt: $1,12
- Learn more about Front Slope
19. Louisburg Square
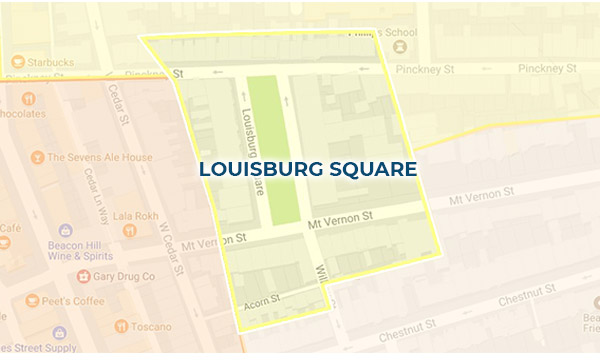
Address: 10 Louisburg Square, Boston, MA 02108, USA
- Average # of Sales per 12 Month Period: 1
- Average Days to Offer: 64
- Average Sale $/SqFt: $1,477
- Learn more about Louisburg Square
20. North Slope
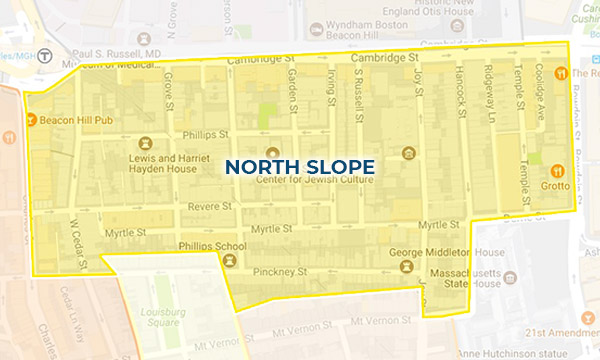
Address: 47 S Russell St, Boston, MA 02114, USA
- Average # of Sales per 12 Month Period:17
- Average Days to Offer: 76.27
- Average Sale $/SqFt: $1,255
- Learn more about North Slope
21. Bay Village
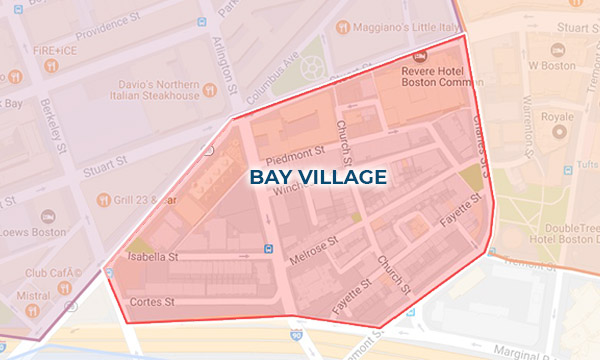
Address: Bay Village, Boston, MA, USA
- Average # of Sales per 12 Month Period: 6
- Average Days to Offer: 24.86
- Average Sale $/SqFt: $1,017
- Learn more about Bay Village
22. New York Streets/Ink Block
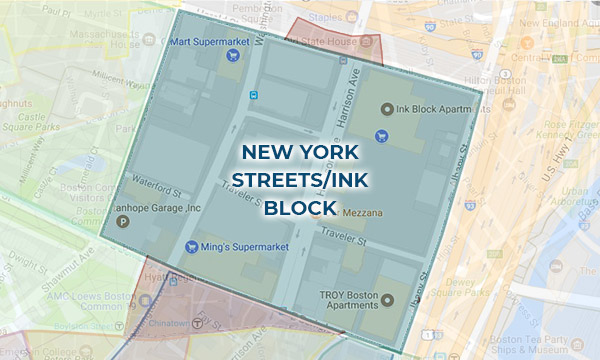
Address: 350 Harrison Ave Unit 3-210 A, Boston, MA 02118, USA
- Average # of Sales per 12 Month Period: 4
- Average Days to Offer: 91
- Average Sale $/SqFt: $1,178
- Learn more about Ink Block
23. South End South

Address: 108 W Concord St, Boston, MA 02118, USA
- Average # of Sales per 12 Month Period: 18
- Average Days to Offer: 46.95
- Average Sale $/SqFt: $964
- Learn more about South End South
24. Blackstone/Franklin Square Neighborhood Association

Address: 690 Harrison Ave, Boston, MA 02118, USA
- Average # of Sales per 12 Month Period: 7
- Average Days to Offer: 65.43
- Average Sale $/SqFt: $1,043
- Learn more about Blackstone and Franklin Square
