Featuring data from $2M+ property sales across 25 Boston sub-neighborhoods.
An analytics driven review of the Boston luxury real estate market. Discover the top luxury buildings driving market value in each neighborhood and more.
Get Your 2022 YER Copy Today!
What's Inside
We believe when real estate consumers are presented with a complete and robust spread of data, in conjunction with their personal preferences, decisions can be reached with the most confidence.
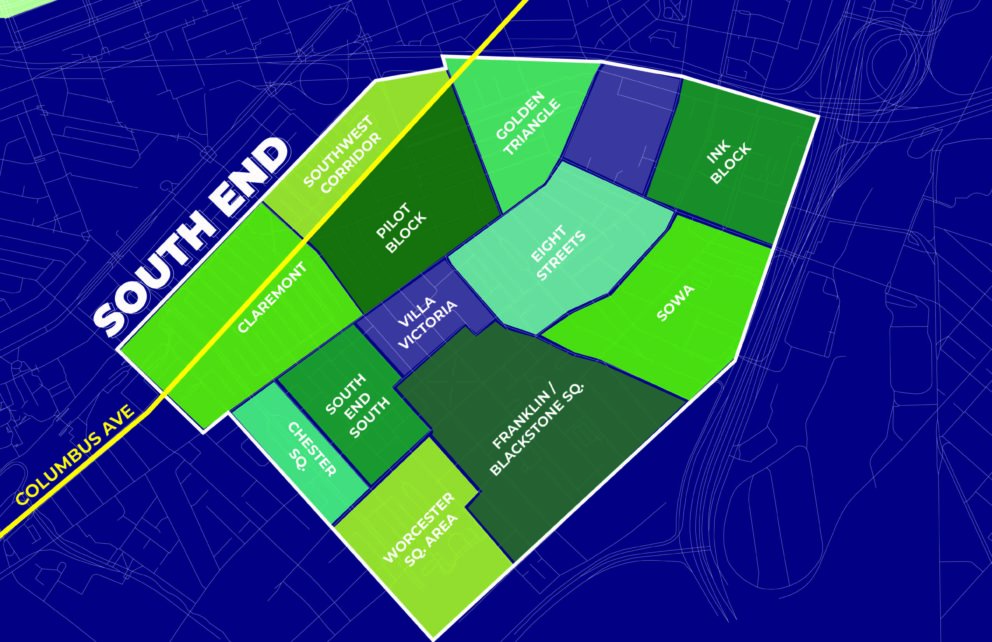
Sub-Neighborhood Analysis
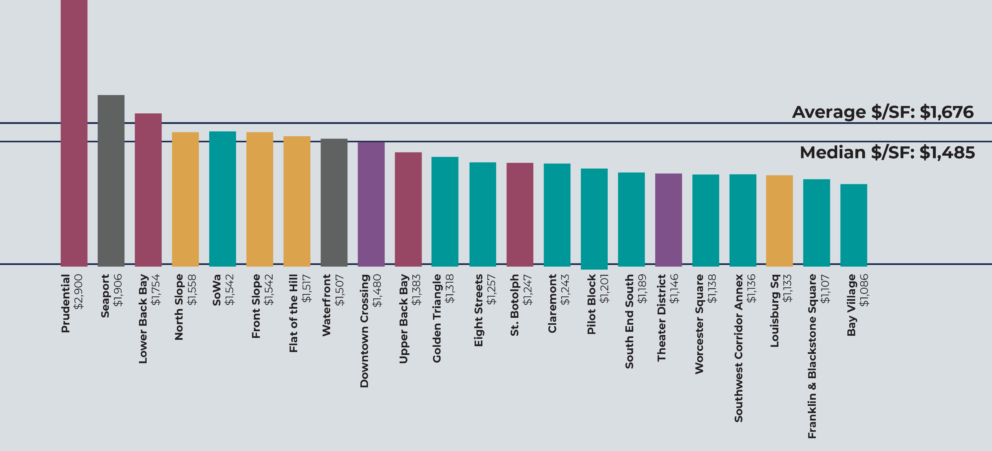
Property sales data across Boston sub-neighborhoods that explores:
- Yearly sales per neighborhood
- Average price per sq. ft.
- Median days on market
- Total market volume
- Highest yearly sales
Get Your 2022 YER Copy Today!