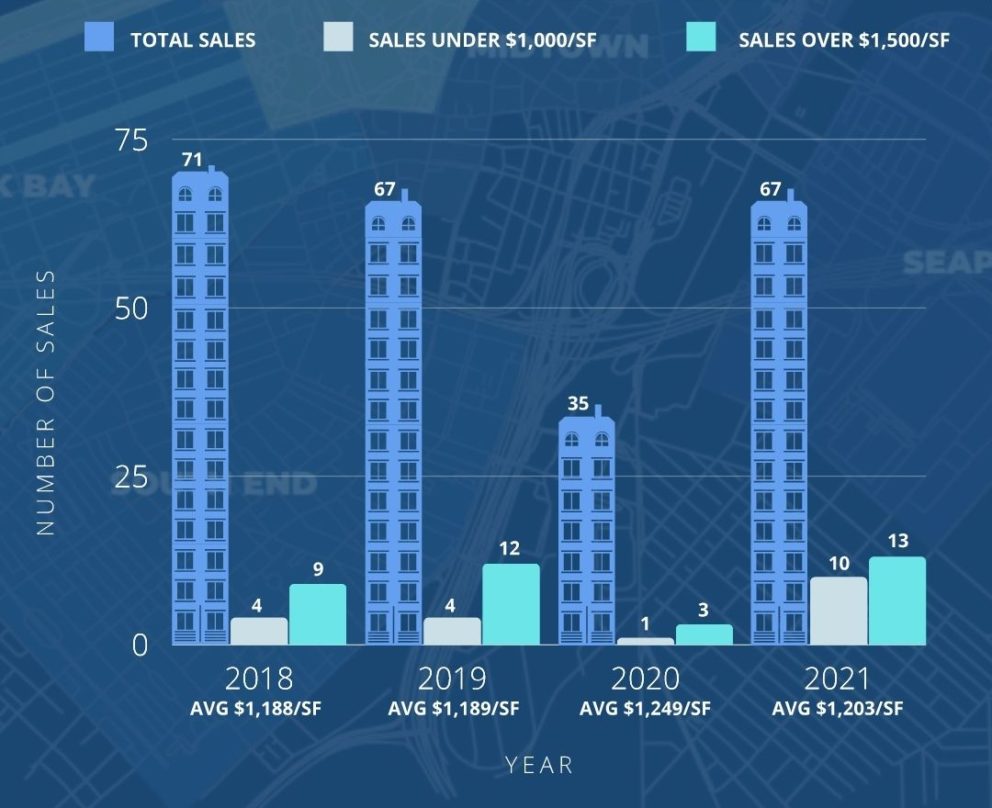
The chart below shows an interesting flow to the pricing and deal velocity in the market over the last several years with an obvious anomalous year in 2020. It’s no secret that the city was “off” during the heights of Covid-19 but what’s surprising, at least from the numbers on the paper perspective, is that the average price per square foot during 2020 was actually the highest (by a wide margin) that we’ve seen.

From the front lines, we can tell you that it was hard to sell condos in the South End during the post Covid world in 2020. Units that would have sold 3 times over in 2018 and 2019 were sitting on the market during 2020 as open houses were sparsely attended with many would-be buyers choosing the suburbs over the city. Ultimately, the units that ended up selling in 2020 were the highest quality assets in the neighborhood. In other words, because there were fewer buyers in the market, all the homes that did sell were the best properties while homes that were not as prime did not sell. Meaning, lower than average price per square foot (vs 2019) sales were barely recorded in 2020. The limited number of active buyers in 2020 were competing with each other for the best properties and, as such, kept the pricing achieved that year on the high side. In 2021, inventory stayed low but buyers did come back and were more willing to purchase units that might not otherwise have been the class of the market. Hence, the average pricing across the market has come back down.
Further to the point, we looked specifically at the number of units that sold under $1,000/SF and over $1,500/SF in the market during each year. 2020 had the least high priced sales and the least low priced sales. Meanwhile, 2021 has seen a major bounceback in both categories. The top of the market is surging with 10x the number of sales under $1,000/SF versus 2020 and 4x the number of sales over $1,500/SF. This was the first year that the South End has seen more than a single sale of a brownstone condominium for more than $1,500/SF. Before the end of the year there will be many more $1,500+/SF sales with closings at the two new buildings in the Ink Block area – 100 Shawmut and the Quinn.
As we head toward the end of the year we will begin work on our annual report covering the luxury market ($2M+) across the core of Boston. We’re eager to flesh out other patterns and trends from sales in the city over the last two years. From our seat, the discrepancy in pricing from the premier properties to the properties that need rehabilitation has never been bigger. It will be interesting to see if that pendulum swings back the other way at all in 2022.
