2016 Year End Market Recap with Pricing Averages and Data visualizations
BY Jeff Hamilton |
January 11, 2017
It was another strong year for Boston luxury real estate in 2016. Here are our year end pricing statistics for the core neighborhoods that we focus on
in downtown Boston.
Some notes:
- Every segment of the market that we track was UP during 2016 against 2015.
- Downtown Crossing’s statistics, in particular, are skewed due to the delivery of 442 units at Millennium Tower. The Tower had 346 units sell for more
than $1M during 2016. - The “% on MLS” statistic is derived from the number of sales that are tracked by MLS (and thus, on market) divided by the number of sales that are
recorded at the registry of deeds (the total number of transactions). - The Beacon Hill ultra luxury market had an impressive year with over 9 percent gains.
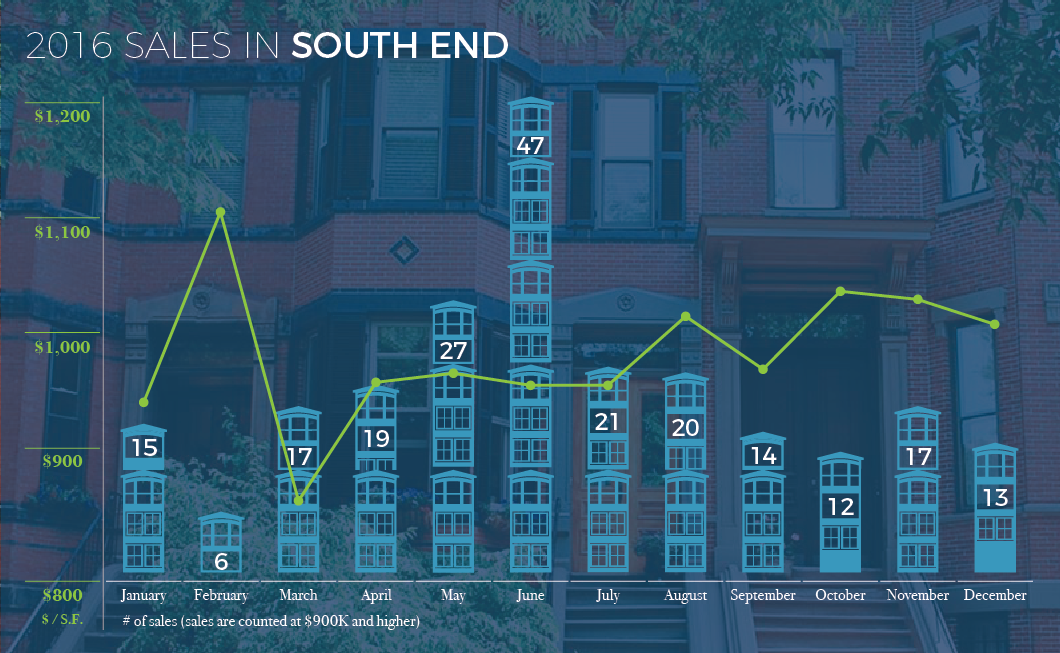
- The South End luxury market continued its march up with 6% gains for the year.
- Other than Downtown Crossing, the number of sales recorded in each market were relatively flat against 2015.

Below you will find some visualizations of the month by month sales for each neighborhood we cover. This should help consumers understand the seasonality
in our business. Listing and buyer activity traditionally peaks in April and May with sales volumes highest in following months of May and June.

![]()