We hope you’ve been able to shake off the summer dust and feel refreshed as we push deeper into a new academic year in Boston. The fall is traditionally
a good time for us to stop and “smell the falling leaves” as it relates to real estate sales. It marks the first moment that we allow the possibility
of a new year (2018?!?) to enter our mind. Buyers and sellers alike are seeking answers to whether the market has softened or if sellers still
have the upper hand in Boston proper.
On the heels of another impressive spring sales season, we’ll look back into the 2017 numbers to see if we can identify trends and patterns in the latest
market data.
We spent some time combing data from August and September over the last three years to see if we could identify directional patterns in the sales figures.
Interestingly enough, looking at sales from those two months alone, the overall price per square foot for properties that sold over $1M in the Back
Bay and South End was down 3.9%. That’s right, would you believe it, property pricing is actually NEGATIVE in Boston over a defined period
of time. That’s a storyline we have not seen in awhile.
Looking at sales figures for the summer months alone , the combined Back Bay and South End markets dropped in pricing from summer 2016 to summer
2017 by 3.9% from $1,215/SF in 2016 to $1,168/SF in 2017.
August/September Condo Sales for South End and Back Bay (Combined)

August/September Condo Sales over the past 3 years by NeighborhoodNot only is the average $/SF down for the South End and Back Bay combined in 2017,
there was also 8% decrease in the number of units sold across these two markets. This decrease was driven by a 31% decline in Back Bay sales for the
period.
August/September Condo Sales over the past 3 years by Neighborhood

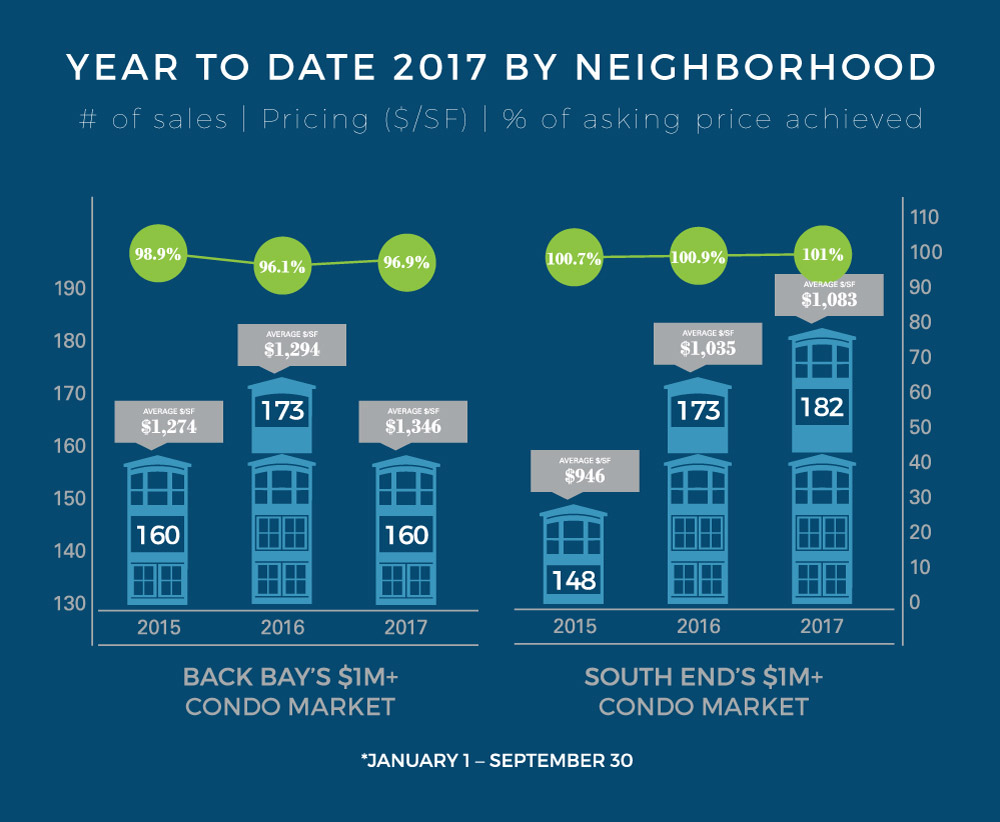
Despite the negative trend during the summer months, the year overall remains positive. Year to date (January 1 through September 30), pricing in South
End and Back Bay’s $1M+ condo market is up versus the same time period in 2016, 8.4% and 4.4%, respectively.

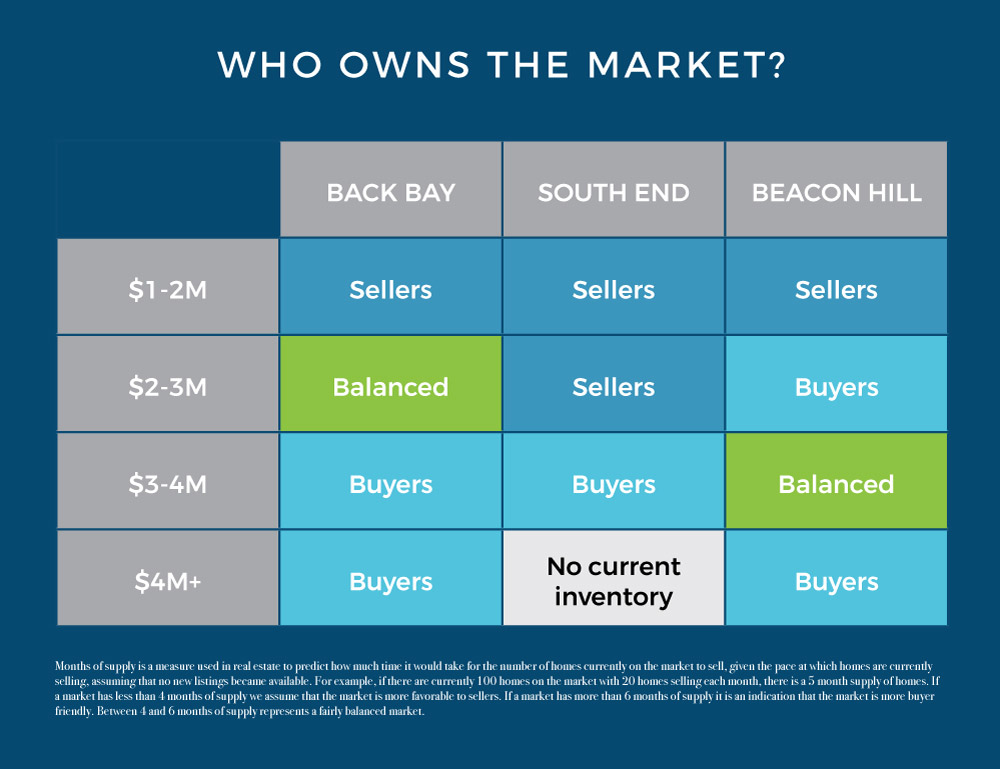
Is it a buyer or seller’s market? To answer this, we like to examine the market inventory (aka “Months of Supply”). Months of supply is a measure used
in real estate to predict how much time it would take for the number of homes currently on the market to sell, given the pace at which homes are currently
selling, assuming that no new listings became available. For example, if there are currently 100 homes on the market with 20 homes selling each month,
there is a 5 month supply of homes in this market. This metric is a good indicator of whether the market is favoring buyers or sellers. If a market
has less than 4 months of supply we assume that the market is more favorable to sellers. If a market has more than 6 months of supply it is an indication
that the market is more buyer friendly, due to an excess of inventory in the market. Between 4 and 6 months of supply represents a fairly balanced
market.

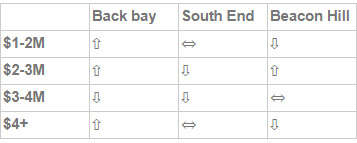
The below table shows the fluctuation in months of supply from 2016. Compared to last year, both the South End and Beacon Hill have seen a decrease in
months of supply (meaning, it will take less time to sell units) in two of their respective submarkets. Beacon Hill’s decrease in $4M+ markets can
be attributed to the sell out of units at the Whitwell, a prominent luxury construction development on Derne Street. Meanwhile, Back Bay only saw a
decrease in the $3-4M range.
Current Months of Supply vs LY

Our view is that luxury pricing and demand will be tempered through the fall market as buyers begin to notice relative discounts against
their expectations. Conversely, sellers may be disappointed to learn that their high expectations for pricing might not hold up to the values they
observed in the spring of 2017. With prices up almost 7% in the Back Bay and close to 13% in the South End since fall of 2015, buyers without supreme
buying power have considered alternative markets like West Broadway in South Boston, where a spike of new inventory and new commercial establishments
has garnered positive attention. Jamaica Plain is similarly interesting to many buyers who would prefer to keep their spend below $1.5M but still expect
to get high end finishes with multiple bedrooms.
Don’t hesitate to let us know if you’d like a more customized analysis of market data. We’re here to help you make sense of the markets.