Your boutique residential real estate consultancy and brokerage specializing in Boston’s most highly sought addresses.


Does a Presidential Election Affect Boston Real Estate?
BY columbusandover |
November 20, 2020
Even before we had a Presidential election for the ages, 2020 has been a year of the utmost uncertainty. We know how the pandemic shifted the real estate market (Q3: State Of The Market) earlier this year but today’s topic has to do with the recent election and how it may or may not have played out in our local real estate market.
If there’s one thing buyers and sellers can come to agreement on quickly, it’s that uncertainty is not a welcome characteristic within the marketplace. While the Boston suburbs have experienced a renaissance in 2020, the “uncertainty sentiment” has been pervasive in the city leading to generally lower demand and pricing in Boston proper. The driving force within the market in 2020 was how can I get more from my home – whether that meant creating office space, fitness space or simply relaxation space, most consumers were looking to optimize and upgrade their living arrangements since they were spending more time at home… and many have been able to do that for a bit less money than they would have spent to do the same in 2019.
But let’s look more closely at the real estate market during election season. Regardless of which political party occupies the White House, it is generally understood that every President has some ability to shape America’s economy. As such, the conventional wisdom is that the month leading up to an election decision tends to be pretty quiet for home buyers as they try to understand what may be the economic tone for the following four years.
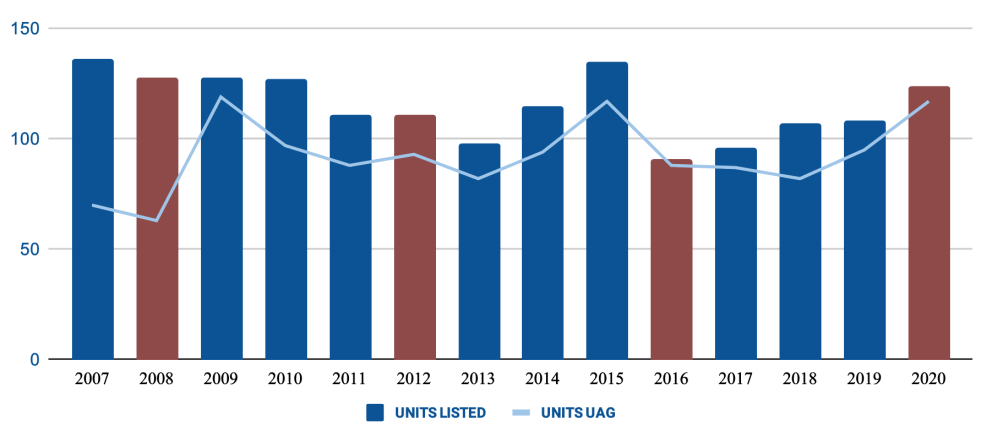
We went back four election cycles and looked at the data for every year since 2007 in the Back Bay, South End and Beacon Hill. We pulled the numbers for both total units listed and the number of units that went under agreement between October 15 and November 15 in each year. Number of units sold in the period is not relevant since those decisions would have been made before the election news cycle really went wild. Here are the results:
The Overview: From Oct. 15 – Nov. 15
SO, WHAT DO YOU TELL PEOPLE YOU LEARNED AT YOUR NEXT VIRTUAL COCKTAIL PARTY?
This year’s highly contested and controversial presidential election had no (negative) bearing on the number of units that were listed or sold during the most active month surrounding the vote in Back Bay, Beacon Hill and South End. Further, according to the data (from MLS), election years do not seem to stimulate a dramatic incline or decline in the number of units listed OR the number of units that go under agreement within core Boston neighborhoods.
WHAT’S BEEN LISTED?
(10/15 – 11/15)
In Back Bay, Beacon Hill and South End neighborhoods the number of listed properties (124 units in 2020) has increased by 36.26% from 91 units listed in 2016. In 2016, we saw the reverse happen. That year, the number of listed units decreased by 18.02% compared to what was listed in 2012. In 2012, we saw a decrease by 13.28% compared to the previous election year in 2008.
WHAT’S GONE UNDER AGREEMENT?
(10/15 – 11/15)
In the same core neighborhoods of Boston (BB/BH/SE), the number of units that went under agreement have increased by 32.95% from 117 units in 2020 from 88 units in 2016 during the month of October 15 to November 15th. The election year of 2016 had an decrease of units under agreement by 5.38% compared to 2012 and in 2012 the market had an increase by 47.62% compared to the previous election year in 2008.
DIVE DEEPER INTO 2020
(10/15 – 11/15)
Taking a closer look into the fall of 2020, the number of units listed in South End, Beacon Hill and Back Bay combined has increased to 124 units, a 14.8% increase from the 108 units listed in 2019 during that same period.
Breaking down the activity in individual neighborhoods in 2020, units listed in the South End have increased by 1.69%; in Beacon Hill units listed have doubled (100% increase); and in Back Bay units listed have increased by 8.11% against the same period in 2019. Under agreement units in South End have increased by 2.63%, in Beacon Hill units that have gone UAG have decreased by 17.65% since 2019, and in Back Bay units uag have increased by 65% since 2019.
CONCLUSIONS
Interestingly, the graphs above did not tell an overly dramatic story. We had hypothesized that both units listed and units under agreement would be down in the election years (shown in red in the graph). The only year the numbers really went down was in 2016. In fact, most surprisingly, units listed and units under agreement showed one of the largest spikes in 2009 and 2020. 2020 was obviously a presidential cycle… but it was also mirrored, in part, by the spike in units under agreement in 2009. What did these years have in common? Well, they both came later into recessionary periods in the US as the bid-ask spread started to soften. Put more succinctly, buyers and sellers were, perhaps, gaining a bit more certainty in their standing during these periods of time allowing market activity to accelerate.
All that said, keep in mind, the period of time we are examining here is very short and steeper gradients should not be interpreted to represent larger trends across the market. We’ll save our end of year report to tackle the broader trends heading into 2021. In the meantime, let us know if we can help you analyze any other specific findings or trends.