Your boutique residential real estate consultancy and brokerage specializing in Boston’s most highly sought addresses.


Lower Back Bay 2018 Recap
BY Jeff Hamilton |
December 10, 2018
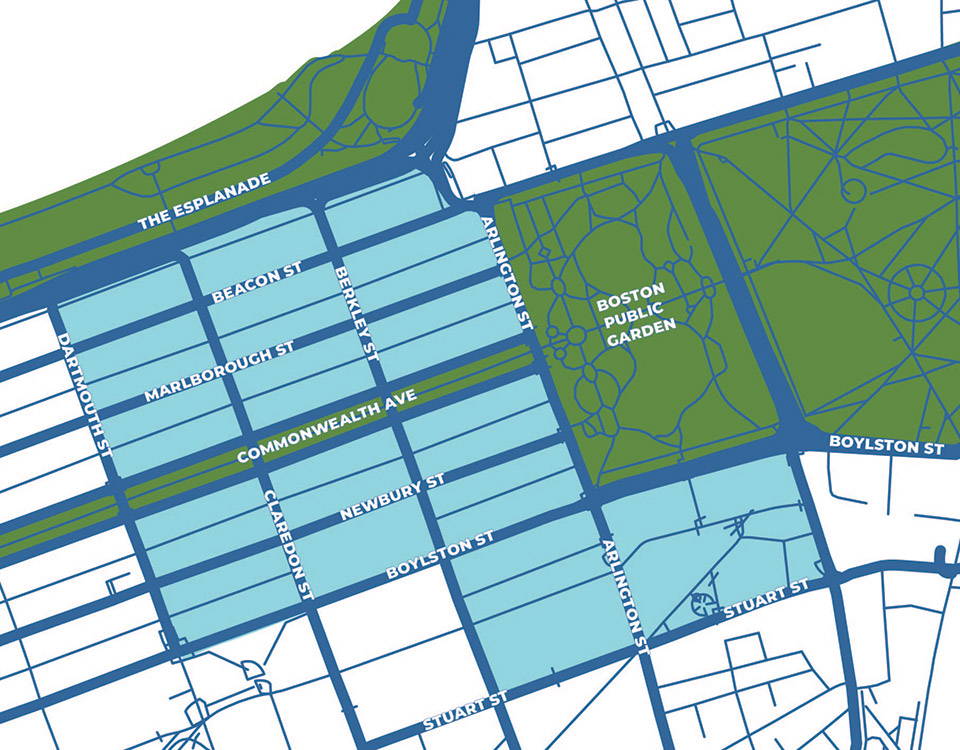
The Lower Back Bay virtually screams prestige. “Lower” addresses on Comm Ave, Marlborough and Beacon Streets provide a canvas for the “who’s who” of Boston to make their lavish abodes on or near the Boston Public Garden. Of course, contrary to some other sub-neighborhoods, history is on your side if you choose to live in the Lower Back Bay. With immediate access and/or views of the Boston Public Garden, the Charles River, and the city skylines, this is an area that demands one put their money where their mouth is if they want to share noteworthy neighbors.
Not surprisingly, for 2018, the volume of transactions over $2M in Lower Back Bay is near the largest of any sub-neighborhood with close to $200M in sales activity. That volume was comprised of 43 total transactions. While 35.8 percent of the Back Bay’s transaction count occurred in Lower Back Bay, an even more impressive 45 percent of the transaction volume was achieved in this sub-market. All that to say, the statistics confirm the anecdotal evidence that suggests people will pay up to live here. With 14 transactions coming in at more than $2,000/SF (and 3 over $3,000/SF), the median price per foot ($1,642) is 6.5 percent below the average price per foot ($1,754).

Furthermore, the premium to live in the lower Back Bay versus the highest priced sub-neighborhood in the South End (Ink Block) is a robust 26 percent when comparing dollars per square foot. As we look at up and coming sub-markets like Midtown and Seaport, we are witnessing a “shiny” object appeal to these places with their glass facades and full service offerings. However, the luster of the Lower Back Bay has been strong for 150 years and we don’t anticipate that changing anytime soon.
Back Bay Market Insights over $2M:
- # of transactions: 44
- # of transactions over $4M: 23
- Total market volume for 2018: $185M+
- Avg. $/SF for 2018 = $1,754
- Med. $/SF for 2018 = $1,642
- Median Days on Market for 2018 = 39
- Median Days to Offer for 2018 = 23
- Top sale ($/SF) for 2018 = $3,100 @ 56 Commonwealth Ave, PH
- Top sale $ for 2018 = $12,550,000 @ 4 Marlborough St